Process Analysis, Real Time Reaction Monitoring & Trend Analysis
Discover the optimal trend in your spectroscopic data! Follow a chemical reaction or similar laboratory process using reaction monitoring.

Peak Analysis
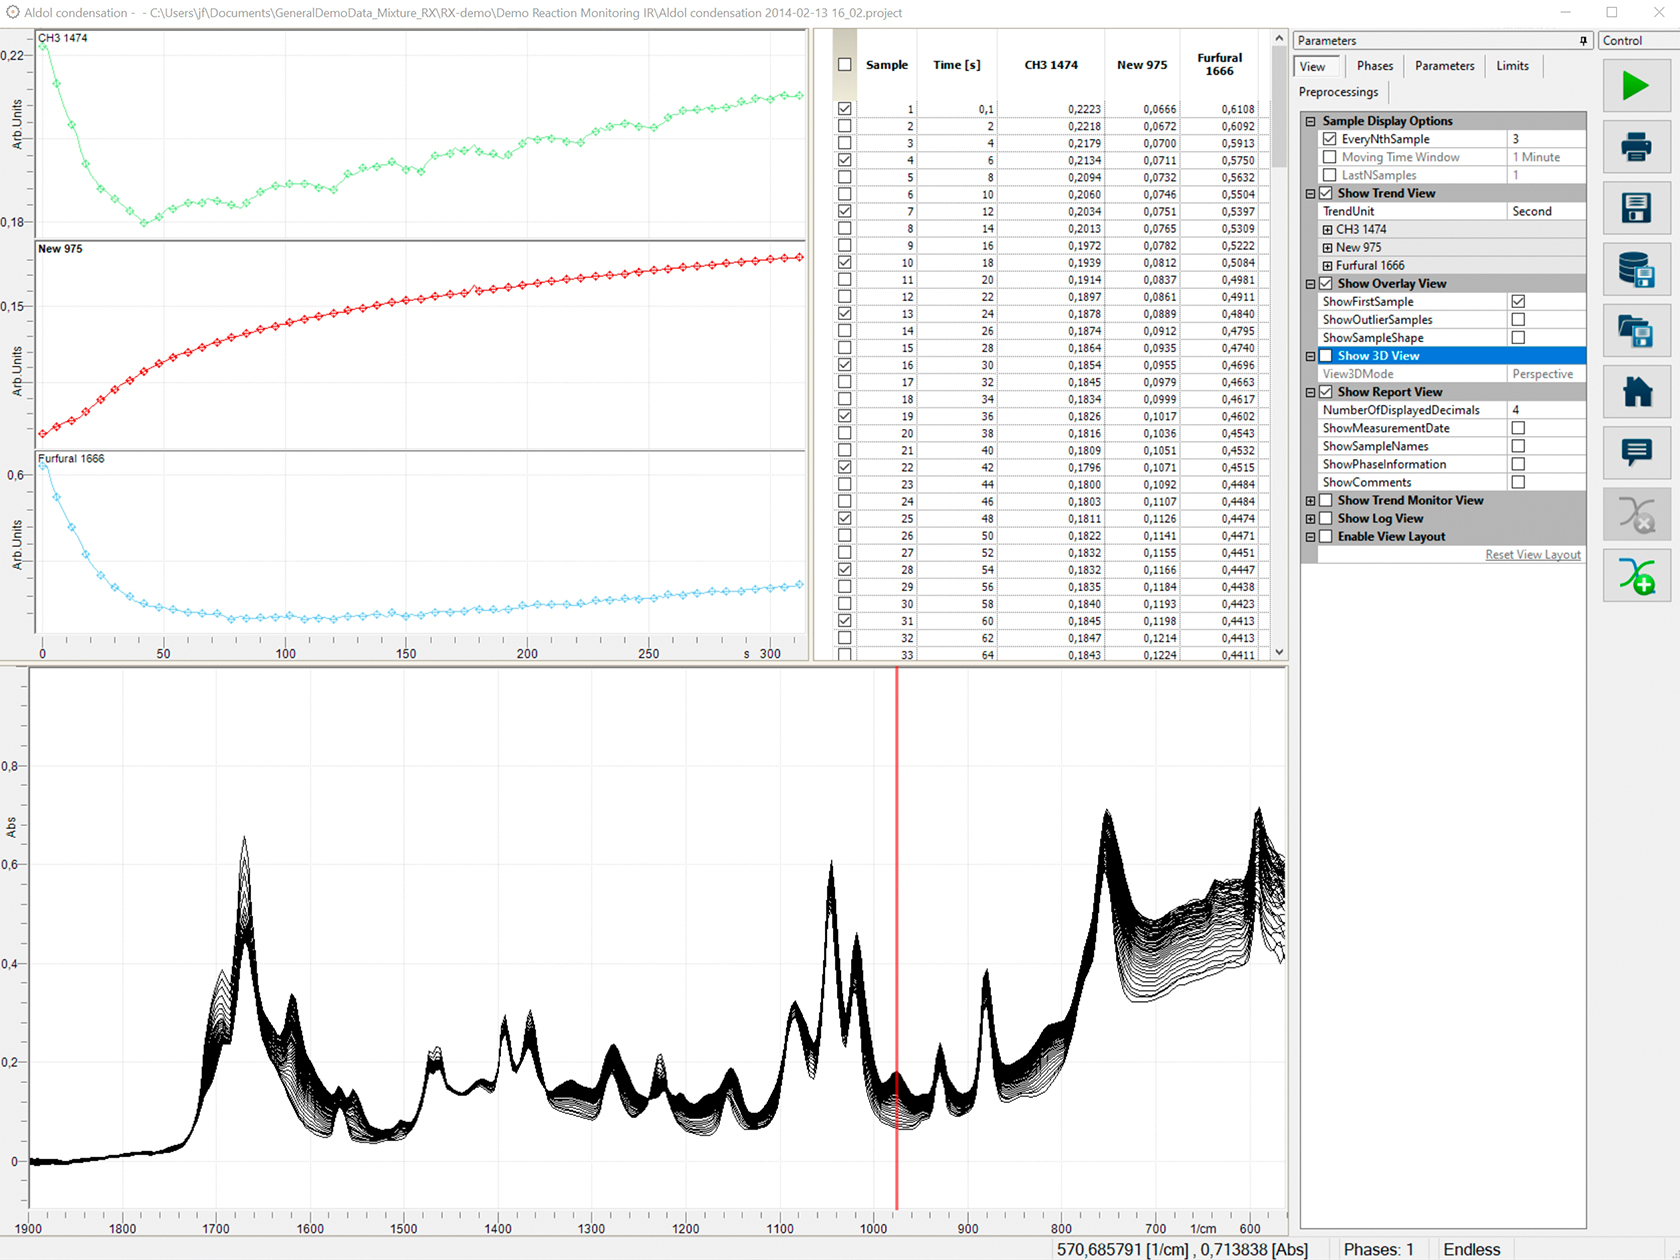
Record a series of spectra, analyze and monitor the trends of particular peaks, or predicted properties derived from all recorded spectra.
Trends are displayed as graph and tabulated values with additional statistical information, such as the best polynomial fit function and regression coefficient. Spectra and the region of interest are shown either as a 2D spectral overlay, or a 3D plot.
Trend analysis can either be performed online while a reaction is running, or offline using a series of already recorded spectra. Run different what-if scenarios by adapting analysis parameters to find the best fit for your analytical problem.
Trend analysis parameters can also be updated while running a reaction, as well as during acquisition of new spectra with your instrument. This gives you optimal flexibility to follow your process.
Have an instrument or spectrometer? Want to measure spectra directly from our software? Check out our Gadget add-on module.

Features
- Wizard guided reaction template creation
A wizard helps you set up a reaction and required trends. A reaction template is created, which may be optimized while running a reaction. - Convenient and intuitive routine and expert user interface
The expert mode is ideal to create a reaction template and try out different what-if scenarios. Once the reaction template is ready, switch to routine mode to simply apply the settings to the next reaction. For your convenience, you willno longer see all the features of the software, but only those required for running the reaction. - Interactive and real time parameter customization
Trend parameters can be adapted in real time to give you a direct response while running the reaction. You may even add new trends or remove trends. This is a feature of the expert mode. - Data preprocessing
Incoming data can be preprocessed before trending. Functions like baseline correction, detrending, and more are available. - Trends and acquired spectra are shown in a multi view window to provide you with the best overview of your reaction. Spectra are displayed as 2D and 3D plots.
- A comprehensive report contains all trend results, including statistical evaluation results.
- Reaction controls
Reactions can be started, stopped, or paused to update parameters or experimental conditions.
Trend Functions
Various evaluation methods are available to create trends, such as:
- Intensity at a particular position in your spectrum
- Intensity ratio of two different positions in your spectrum
- Peak characteristics like height, absolute height, or peak area
- Ratio of two peaks
- Custom evaluation formulas using spectral parameters and other numerical information attached to the spectra as labels
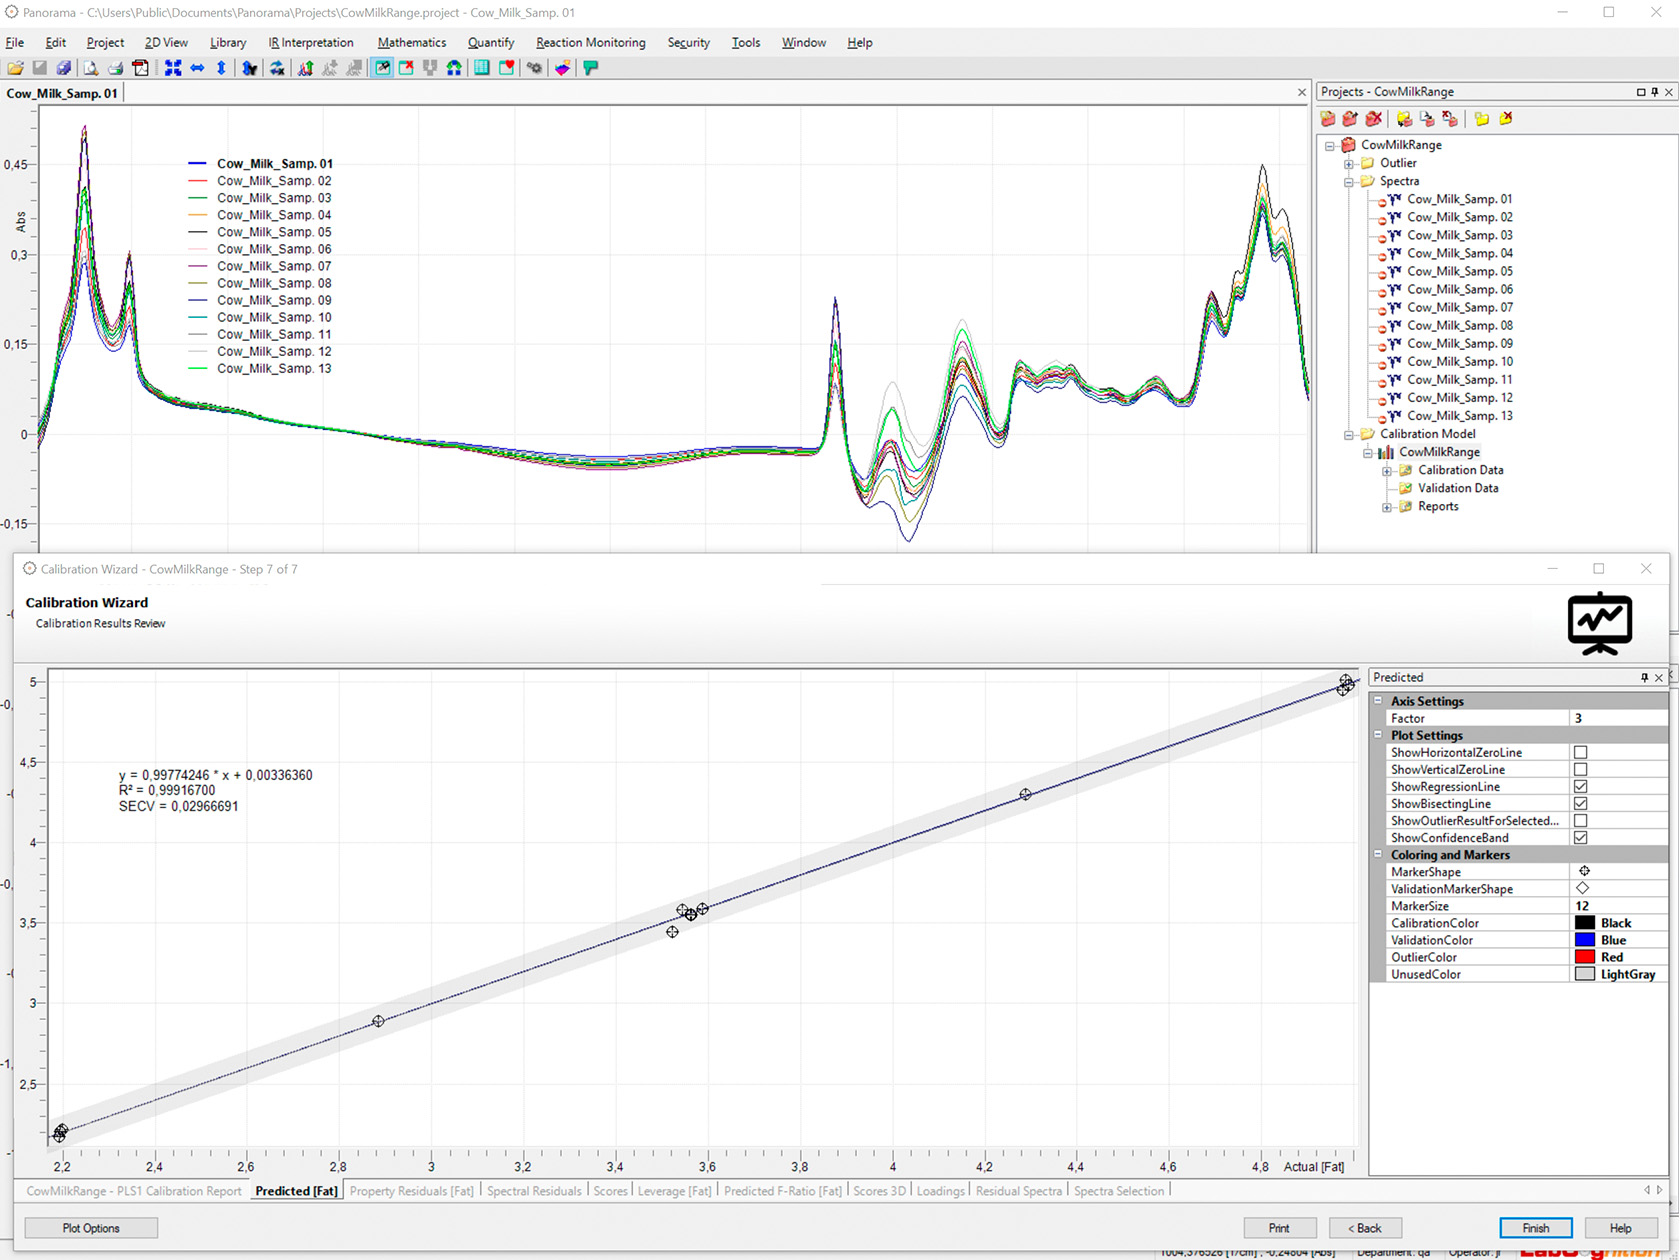
- Chemometric methods as described for the Quantify add-on module, such as multivariate calibrations (PLS-1, PLS-2, PCR, MLR, etc...) to predict spectral or product properties
Trend Monitor - Quality Control
The trend monitor is ideal for quality control. It shows current trend values and colored outliers in a simplified view. You can easily decide when a reaction needs to be stopped or interrupted. Outliers are automatically counted, and data can be explicitly exported following different conditions.
Feel free to contact us if you're interested in expanding your software with the add-on module for reaction monitoring.